Data
Data analysis was done using several packages (plyr, Hmisc) designed for ‘R’. Data analysis revealed that fringe ecosystem was dominated by red mangroves while riverine ecosystem was dominated by black mangrove. Fringe ecosystems are located in six coastal regions, known as Region -1, 2, 3,4,5,6. None of the regions or ecosystem revealed normal distribution of DBH data (Figure 3). All of them are highly skewed towards higher end of the boxplot. Region 1 recorded the highest DBH and maximum mean DBH. Region - 2, 3, 4, 5, Berbice and Essequibo riverine ecosystem has too many outliers that are critical to decide in favor of non-parametric statistical data analysis.
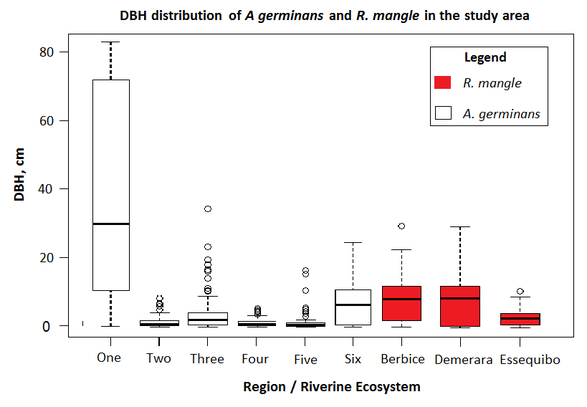
Figure 3: Boxplot of DBH distribution of the selected species in the study area
Several transformations (log10 , log2, square root, log-constant) had been attempted to convert the data to normal distribution, but failed to do so (Figure 4) .
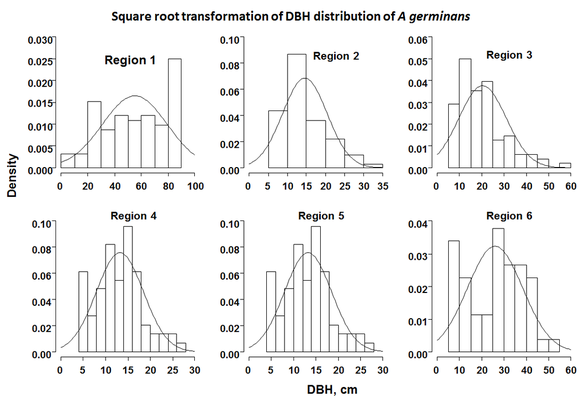
Figure 4: Histogram of Square root transformation for black mangrove's DBH in fringe ecosystem
Although one-way ANOVA analysis between regions and carbon (Mg/ha) revealed that the mean carbon in all regions and ecosystem are significantly different from each other [F(8,653) = 87.10, p = 0.0000), residual analysis, histogram of residuals and Shapiro-Wilk normality (W = 0.78, p-value < 2.2e-16) test confirmed the data being not normal as previously shown in the boxplot. As such, kruskal-wallis test (non-parametric test) had been performed (Kruskal-wallis chi-squared = 243.92, df = 8, p-value <2.2e-16). It depicted that the mean ranks for carbon (Mg/ha) in regions and ecosystem are significantly different from each other.
